The perfect tool for fully automated nanomechanical data acquisition and analysis
The ANA system is an automated solution for AFM-based nanomechanical analysis. It is designed to investigate the nanomechanical properties of materials such as cells, tissues, scaffolds, hydrogels, and polymers on multiple or large samples via force spectroscopy and force mapping in an intuitive and automated fashion.
ANA is compatible with Nanosurf's FlexAFM scan heads: for materials science in the Flex-Axiom setup, as well as for life science applications in the Flex-Bio setup on an inverted microscope.
I really enjoy using the Flex-ANA for its excellent force mapping capabilities on polymer materials. The scientists at Nanosurf are highly knowledgeable and responsive, and have developed an easy-to-use system with many features (both in hardware and software) purposefully designed for force curve measurements.
From automated calibrations and programmable stages to streamlined integration of multiple data sets, the Flex-ANA offers important benefits for any research involving force curve measurements.
Nanomechanical analysis of large or multiple samples
The combination of a straight-forward workflow-based experimental procedure in the ANA software, carefully selected hardware elements and motorization, and well-designed and thought-through control algorithms are hallmarks of the Flex-ANA system. Measurement locations on large or multiple samples are defined by simply clicking on an overview image with a large field-of-view that covers the entire accessible 32 mm × 32 mm sample area. Height differences of up to 5 mm can be easily overcome by the system, and many types of nanomechanical measurements, analyses and models can be performed and used!
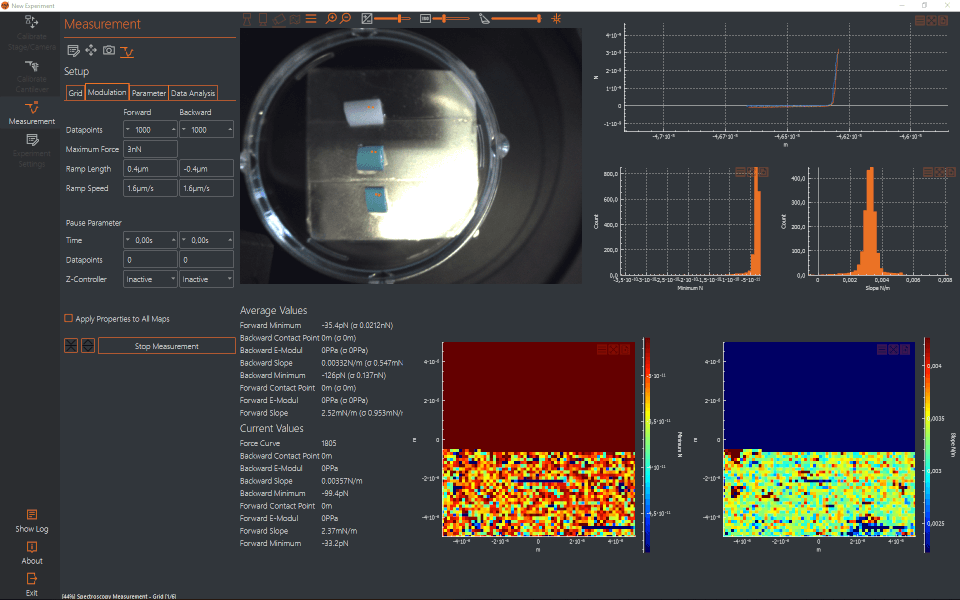
Demonstration of the ANA workflow. The software provides a clearly structured interface, featuring wizards for calibration and measurement definition.
Handle demanding samples with ease
During an experiment, the ANA system coordinates the movement of the scan head and the motorized XYZ translation stage (range: 32 mm × 32 mm × 5 mm) to cope with large sample height variations. The system can optionally be equipped with an additional 100-µm Z piezo for an extended force spectroscopy range. Thus, samples with macroscopic and microscopic roughness in the range of several millimeters and micrometers, respectively, as well as soft and sticky samples, can be easily addressed.
Learn about details in our webinar by Dr. Edward Nelson
Learn about the automated nanomechancial analysis module and its application in analyzing blended polymers. See the ease of use in data collection and analysis, and how automated collection of data from multiple samples has the potential to save time and make your research more efficient.
Operation by experts as well as novice users
The ANA control software provides a Basic and an Expert user mode that are designed for different degrees of user experience and training:
In Basic mode, less experienced users are guided through the setup and calibration of the ANA system step-by-step. Optimized workflows guarantee that everything is done in the correct sequence, that nothing is forgotten, and that all is set properly.
In Expert mode, experienced users have more freedom in operating and setting up the system to suit their individual needs. Measurement parameters can also be prepared and stored by an expert, and then subsequently used by less experienced users in Basic mode.
The ANA software was partly developed within the framework of the OYSTER project, which has received funding from the European Union’s Horizon 2020 research and innovation program under grant agreement No 760827.
Applications
ANA application examples
Nanomechanical analysis of alginate hydrogels
Here we used the Flex-ANA system to investigate the elasticity of flat alginate gels for cell culture. Analysis of different areas of the gel at different resolutions revealed a significant spatial heterogeneity of the gel at the macroscopic level as well as at the microscopic level. Additionally, the force curve-based elasticity measurements also reveal first information about the porosity of the sample.
Optical image of the alginate sample overlaid with the elastic modulus measured in different areas and box-whisker plots of the elastic moduli of the different spots
(A) Optical image of the sample. The black lines indicate the boundaries of the glass-supported gel. The colored squares correspond to the median elastic modulus measured at 21 different spots (40 × 40 µm2 area) on the alginate gel. The median elastic modulus varies between ~500 kPa and ~4 MPa. Also within a single spot area, a considerable spread of the elastic moduli can be observed. The box-whisker plot (B) indicates the distribution of the elastic moduli within each measured spot. The boxes shown in B represent the 25 to 75 percentiles while the whiskers represent the 10 and 90 percentiles. The green bars in B indicate the median elastic modulus for each spot. The shift of the average elastic moduli (blue diamonds) to higher values compared to the mean values underlines the tailing of the elstic modulus distributions towards higher values. The numbers next to the squares in A correspond to the spot numbering in the box-whisker plot.
Elastic modulus (A&C) and height maps (B&D) of two differently sized areas. Color bars correspond to 6.2 MPa for the modulus maps (A&C) and 400 nm for the height maps (B&D)
Force maps recorded on a 5 × 5 µm2 (A & B) and 2 × 2 µm2 area (C & D) show the local elastic modulus variations within each area (A & C) as well as the zero force height of the sample (B & D) that corresponds to the unperturbed sample topography. The elastic modulus maps show considerable local differences of the elastic modulus on the sub-micrometer scale. The height maps indicate a heterogeneous sample porosity. The elastic modulus contrast does not correlate with the sample topography.
All measurements were performed in aqueous solution with 300 mosmol CaCl2 using a Nanosensors qp-CONT cantilever with a nominal spring constant of 0.1 N/m. The Flex-ANA software package was used to acquire 2500 force-distance curves for each spot and to perform analysis using the Sneddon model.
Mechanical measurement on medical tubings
Here, the Nanosurf Flex-ANA system was used to investigate the mechanical properties of three different medical tubings in a single run. While one of the tubings was uncoated, the other two tubings were bearing different polymeric coatings.
Optical sample overview image with predefined measurement locations.
The overview image of the sample shows the three pieces of tubing overlayed with the locations at which the system will automatically perform the mechanical testing experiments (numbered 1-12).
Elastic modulus distribution of the three different medical tubings.
Elastic modulus recorded on the different medical tubings. The polymeric coatings confer elastic moduli to the tubing surfaces that are orders of magnitude below the uncoated tubing. This softness is comparable to that found in soft biological tissue. The histogram shows the pooled results of at least three different areas probed on each tubing. Samples were equillibrated and immersed in PBS buffer for nanomechanical measurements using a Nanosensors PPP-ContSCAuD cantilever.
AFM topography recorded on different tubings
The Flex-ANA system retains its full research AFM capabilities, which for example allows recording the sample topography and thus measuring the sample roughness. The top AFM topography corresponds to a coated tubing, while the bottom AFM topography was recorded on an uncoated tubing. The sample roughness is clearly influenced by the coating. Further, the coating also influences the friction of the surface (not shown, please refer to the application note PFD)
AFM images were recorded in dynamic mode with the samples immersed in PBS buffer. Images were processed using the Nanosurf Report Software.
ANA image gallery
Force mapping of living cultured cells
AFM force spectroscopy on a polymer blend
References
ANA references
User's experience
Dr. Dalia Jablon
"I really enjoy using the Flex-ANA for its force mapping capabilities on polymer materials"
The scientists at Nanosurf are highly knowledgeable and responsive, and have developed an easy-to-use system with many features — both in hardware and software — purposefully designed for force curve measurements.
From automated calibrations and programmable stages to streamlined integration of multiple data sets, the Flex-ANA offers important benefits for any research involving force curve measurements.
Electrospraying and ultraviolet light curing of nanometer-thin polydimethylsiloxane membranes for low-voltage dielectric elastomer transducers
B Osmani, T Töpper, M Siketanc, G M Kovacs, and B Müller
A number of applications such as tunable optics, microfluidics, or soft robotics show growing interest in soft dielectric elastomer transducers. Still, such transducers require actuation voltages of hundreds of volts to obtain the required compressive strain. For biomedical applications, however, only a few tens of volts may be applied to such transducers. The achievable compressive strain of dielectric elastomer transducers increases with decreasing film thickness and elastic modulus.
In this publication, Osmani et al. from the Biomaterials Science Center of the University Basel report the fabrication of smooth and soft dielectric elastomer films with thickness of 1 µm and below for application in multilayer dielectric elastomer transducers. In this study, the Flex-ANA system was used to characterize the effect of UV irradiation on the elastic modulus of the thin films. Depending on the UV irradiation time, elastic moduli of the polymer films of only a few hundred kPa could be obtained, approaching the elastic modulus of human tissue.
Additionally, the FlexAFM was used to evaluate the films' surface roughness and to induce scratches for film thickness determination.
Morphology and conductivity of Au films on polydimethylsiloxane using (3-mercaptopropyl)trimethoxysilane (MPTMS) as an adhesion promoter
B Osmani, H Deyhle, FM Weiss, T Töpper, M Karapetkova, V Leung, B Müller
Dielectric actuators (DEAs) often referred to as artificial muscles are promising devices for biomedical applications. Flat DEAs are commonly comprised of elastomers sandwiched between two compliant electrodes. Researchers from the University of Basel developed an approach to improve the interface between the elastomer and the electrodes. The Flex-ANA system was used to evaluate and compare the effects the interface and the electrode thickness have on the overall elastic modulus of the DEA, which is a crucial parameter for design and operation of future implant devices. Image courtesy Bekim Osmani, Biomaterials Science Center, University of Basel


 and height maps (B&D) of two differently sized areas.")