AFM Force spectroscopy refers to single point measurements in which the cantilever approaches and “pokes into” the sample, and then withdraws. During this measurement the cantilever deflection vs. piezo movement is measured, and this can ultimately be converted to a force vs. tip sample separation measurement that provides mechanical information about the sample. This conversion requires the calibration of the spring constant and deflection sensitivity. A model force curve of cantilever deflection vs. z piezo looks as follows:
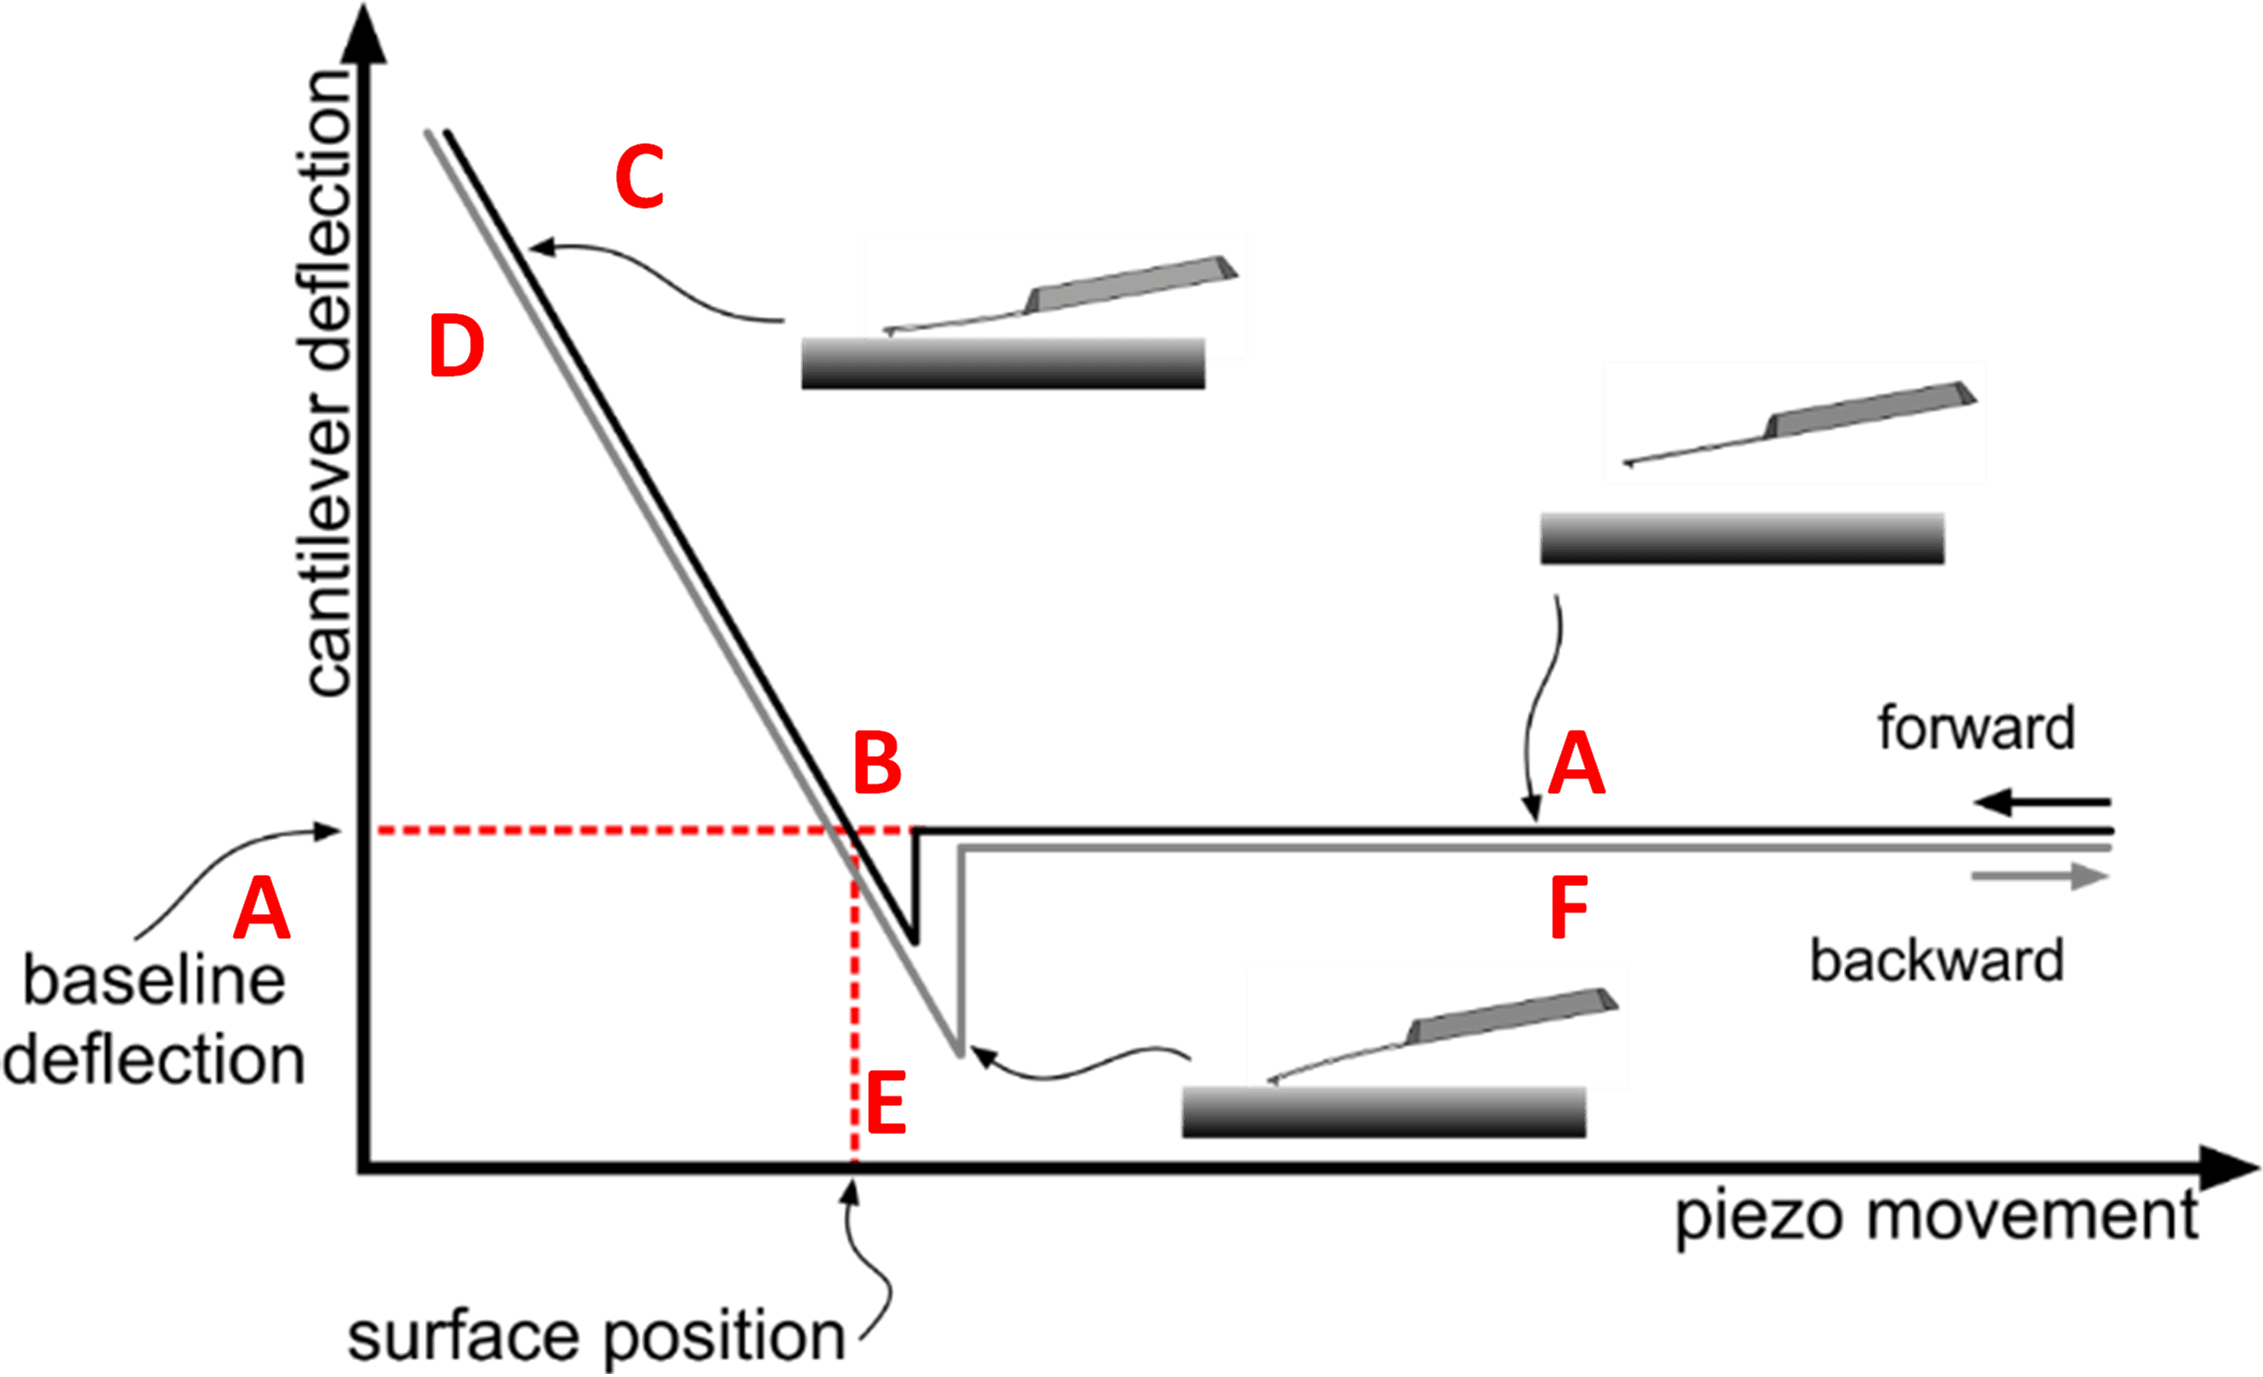
The force curve can be divided in different segments where A-C (black line) refers to motion where the tip is approaching the surface and D-F (gray line) is when the tip is retracting from the surface. The gray line has been given an artifical offset for illustrative purposes:
- Cantilever is approaching the surface. If there are attractive or repulsive forces between the tip and the sample, those could be measured in this segment by the resp. down or up bending of the cantilever.
- “Snap-in”: the cantilever snaps into contact with the sample. This snap-in is due to tip-surface interactions, like capillary forces.
- Repulsive portion: the tip and sample are in contact and bends up upon further movement of the z-piezo. This section is referred to as the net-repulsive portion.
- Repulsive portion on withdrawal: the tip is now unbending while being withdrawn from the surface.
- Pull-out: the tip gets “stuck” in an adhesive dip before it is able to emerge from the adhesion at the interface.
- The cantilever has returned to its unperturbed state while the z-piezo further increases the tip sample distance.
Modulus Measurements
AFM Force curves can be mined for various mechanical properties of the sample including adhesion, stiffness (modulus), rupture force, and indentation depth (how much the tip penetrates into the sample at a given load).
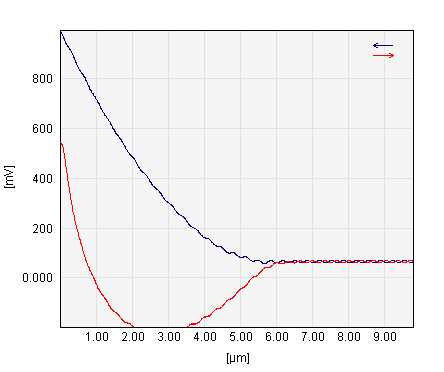
Shown below are example force measurements from different polymer samples collected on a Flex-ANA. Clearly the sample on the left is very soft and has high adhesion compared to sample on the right, which is stiffer (higher slope on repulsive wall) and less sticky.

Contact mechanics models that model the tip-sample interaction are needed in order to extract the pertinent mechanical information from the force curve. There are a variety of contact mechanics models such as Hertz, Sneddon, DMT, and JKR that can be used depending on the sample and the specifics of the tip-sample interaction. The force curve data are fit with the appropriate model in order to extract the mechanical property information.
Adhesion Measurements
Measuring the stickiness or adhesion of a sample with an atomic force microscope can be done by measuring the adhesive dip in a force curve collected through force spectroscopy. The adhesion was measured on the blend of polybutadiene and polystyrene revealing quantitatively different adhesive dips on the 2 materials, as shown in the force curves below on the two materials.

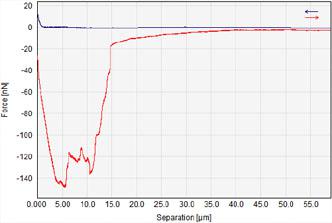
Adhesion measurements can also be extended to single cells and bacteria with Flex-FPM — which uses FluidFM™ technology with hollow cantilevers and a microfluidics control system. In such experiments cells are aspired to a hollow probe like a sock to a vacuum cleaner and subsequently pulled away from the surface, while measuring the cantilever deflection.
Unfolding and Stretching Measurements
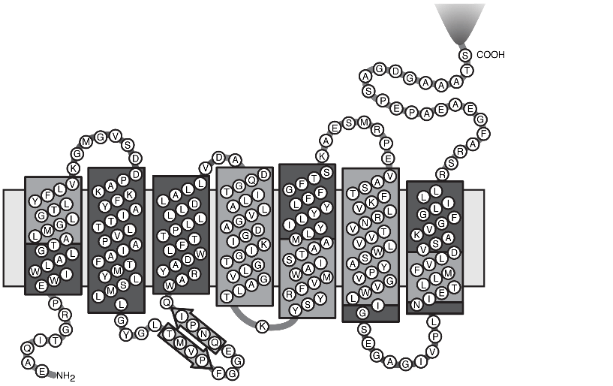
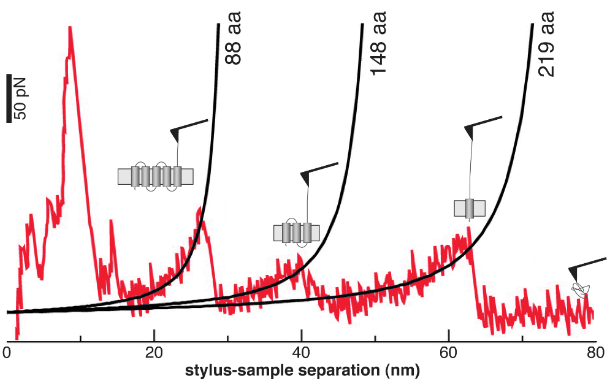
Another application of force spectroscopy is the stretching of molecules tethered between the cantilever tip and a sample. In biological research it has gained a lot of popularity to study phenomena such as protein unfolding, which is challenging or impossible with other techniques. An intensively studied example is the sequential unfolding of bacteriorhodopsin (BR), a light-driven proton pump. The cantilever/tip is able to grab onto the bacteriorhodopsin and pull it out of the membrane. During this process discrete unfolding steps are captured in the force curve measurement as shown in the data below. The protein unfolding events can thus be quantified by yielding the force required for the individual mechanical unfolding steps as well as the (increase of) length of the unfolded stretch of molecule tethered between tip and membrane from one unfolding event to the next.
Force Mapping
Because force curves are single point measurements, often many measurements are needed in order to obtain accurate and meaningful data in what is termed force mapping. All Nanosurf product lines are capable of force mapping with grid automation, in addition to automated analysis to calculate slopes, snap-in, and adhesive forces. On the PS-PB polymer blend below, for example, a grid of force curves was collected and the adhesion measured. The 3D map where the adhesion is colored onto the 3D topography clearly shows the different adhesive properties of the two components, where the polystyrene (round domain in the right bottom) has higher adhesion than the surrounding polybutadiene. The data were subsequently compiled into a histogram for further quantification.
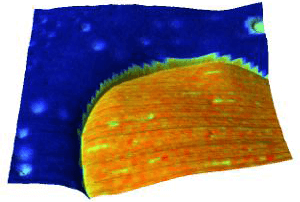
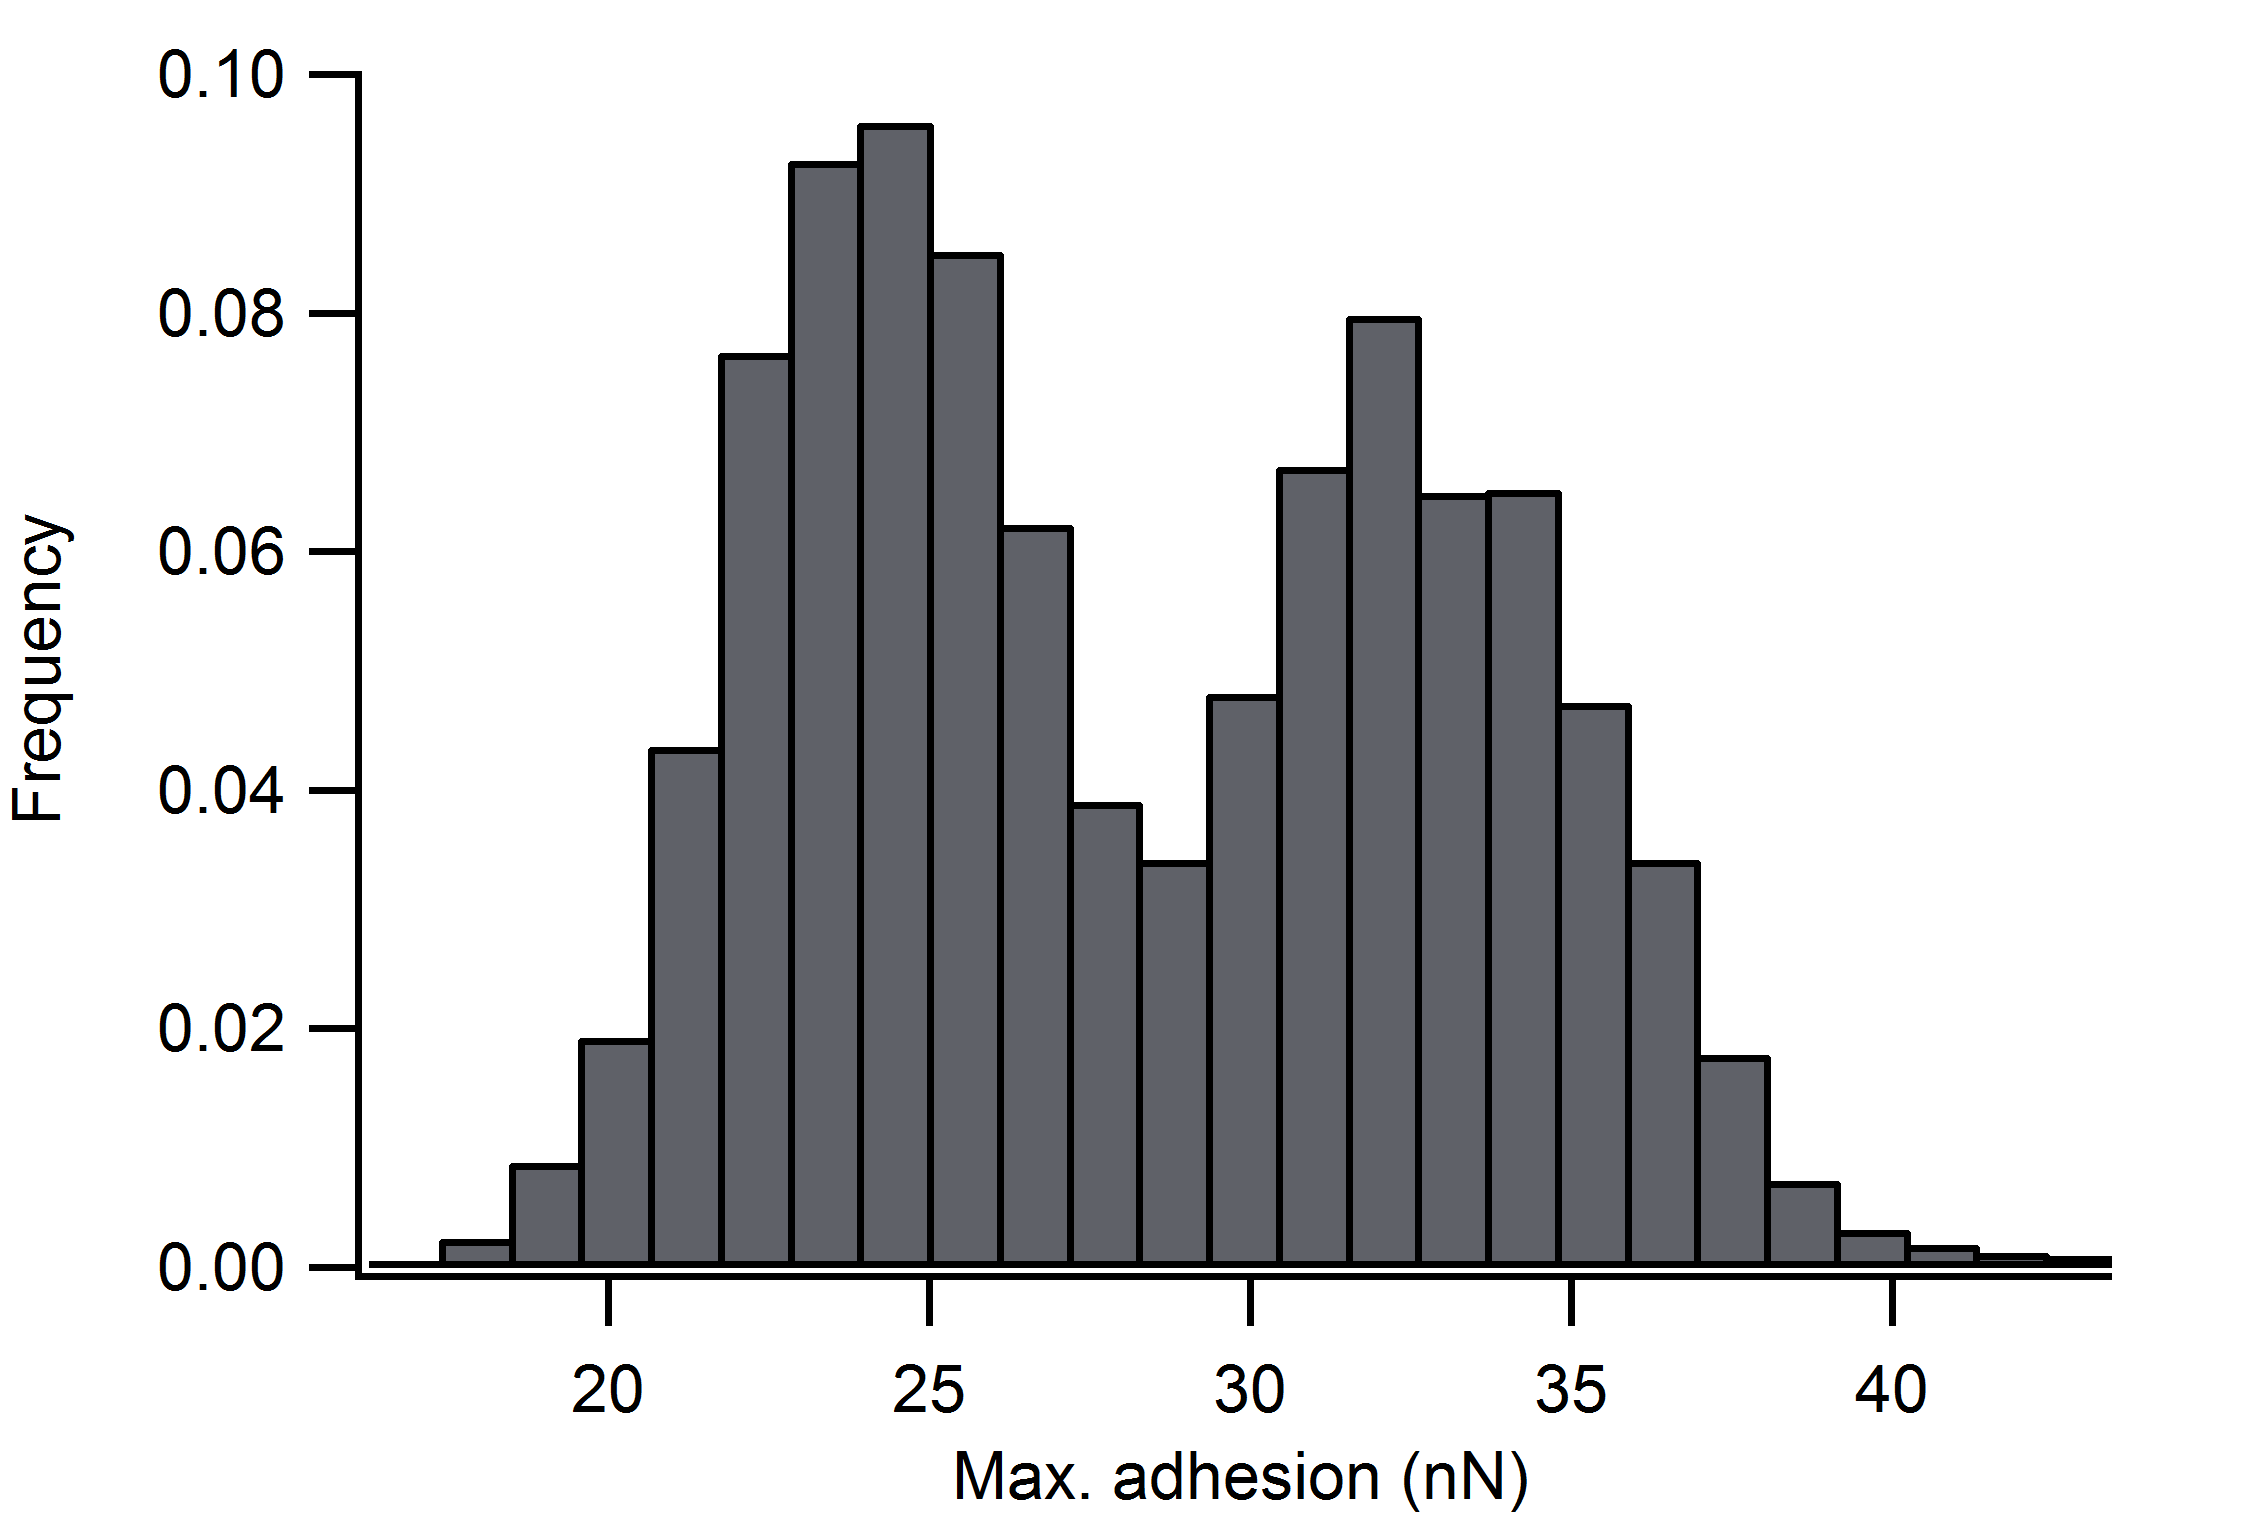
With histograms, parameters obtained from force curves, like the adhesion above, are easier to quantify, obtain the average values of the different peaks as well as their separation, and their distribution via the standard deviation or full width at half maximum for a peak.
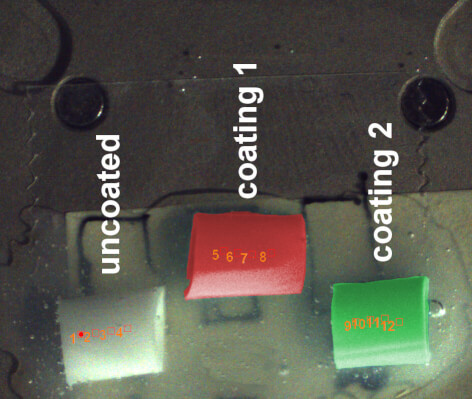
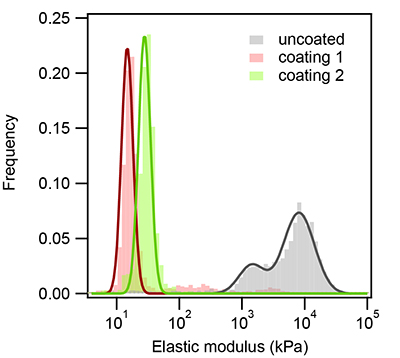
The elastic modulus can be analyzed similarly. Using force curve mapping where force curves are collected over an area, the mechanical properties of medical tubing was investigated and shown in the data below. The three tube samples were uncoated, and then coated with different polymeric coatings. In a single run, the automated Flex-ANA was able to measure the elastic modulus on all 3 samples, which were equilibrated and immersed in PBS buffer, revealing that the coated tubing was much softer than the uncoated tubing. The softness in this case was a desirable feature, as it is comparable to that found in soft biological tissue, thus making it appropriate for medical applications.
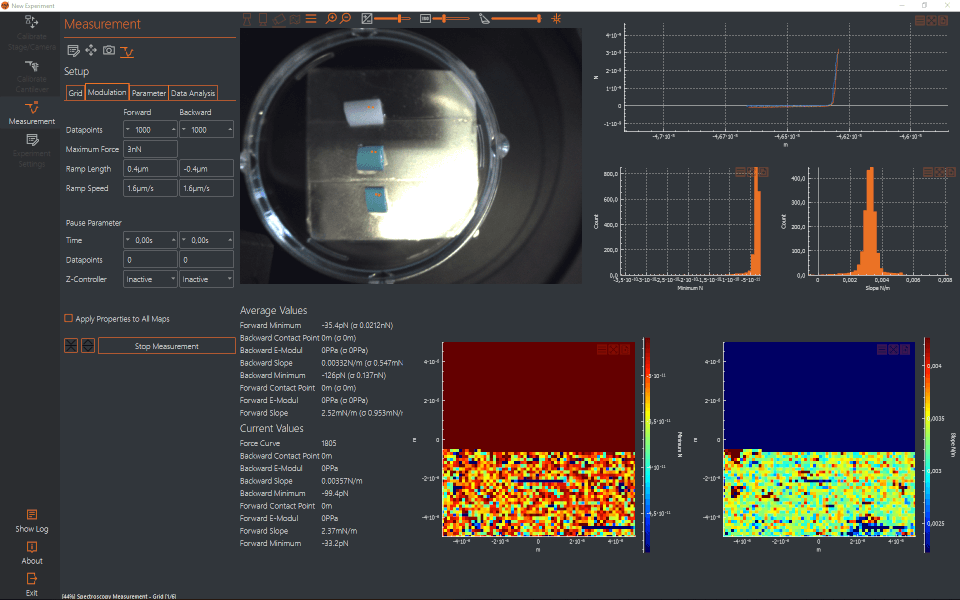
Sophisticated force mapping that can accommodate a wide variety of sample configurations and automated collection and software analysis, with a choice of contact mechanics models, is offered in the Flex-ANA. With this instrument, a series of samples can be programmed for force mapping, followed by a streamlined quantitative analysis and integration of multiple data sets. Individual force curves are displayed during collection, and a histogram of the various properties builds up in real time, as shown in the software screenshot below.
