During the past decade it has become more and more evident that (stem) cell differentiation does not solely depend on biochemical factors. The mechanical properties of the environment are important factors that can direct cell differentiation. Consequently, hydrogels that can be tuned in their chemical and mechanical properties are nowadays widely used as cell culture substrates to mimic the environment that cells would experience in their host tissue.
Here, we tested the elastic modulus of gelatin gels of different composition that are used as cell culture substrates. All gels were assessed during a single experimental run. No user action was required after starting the experiment.
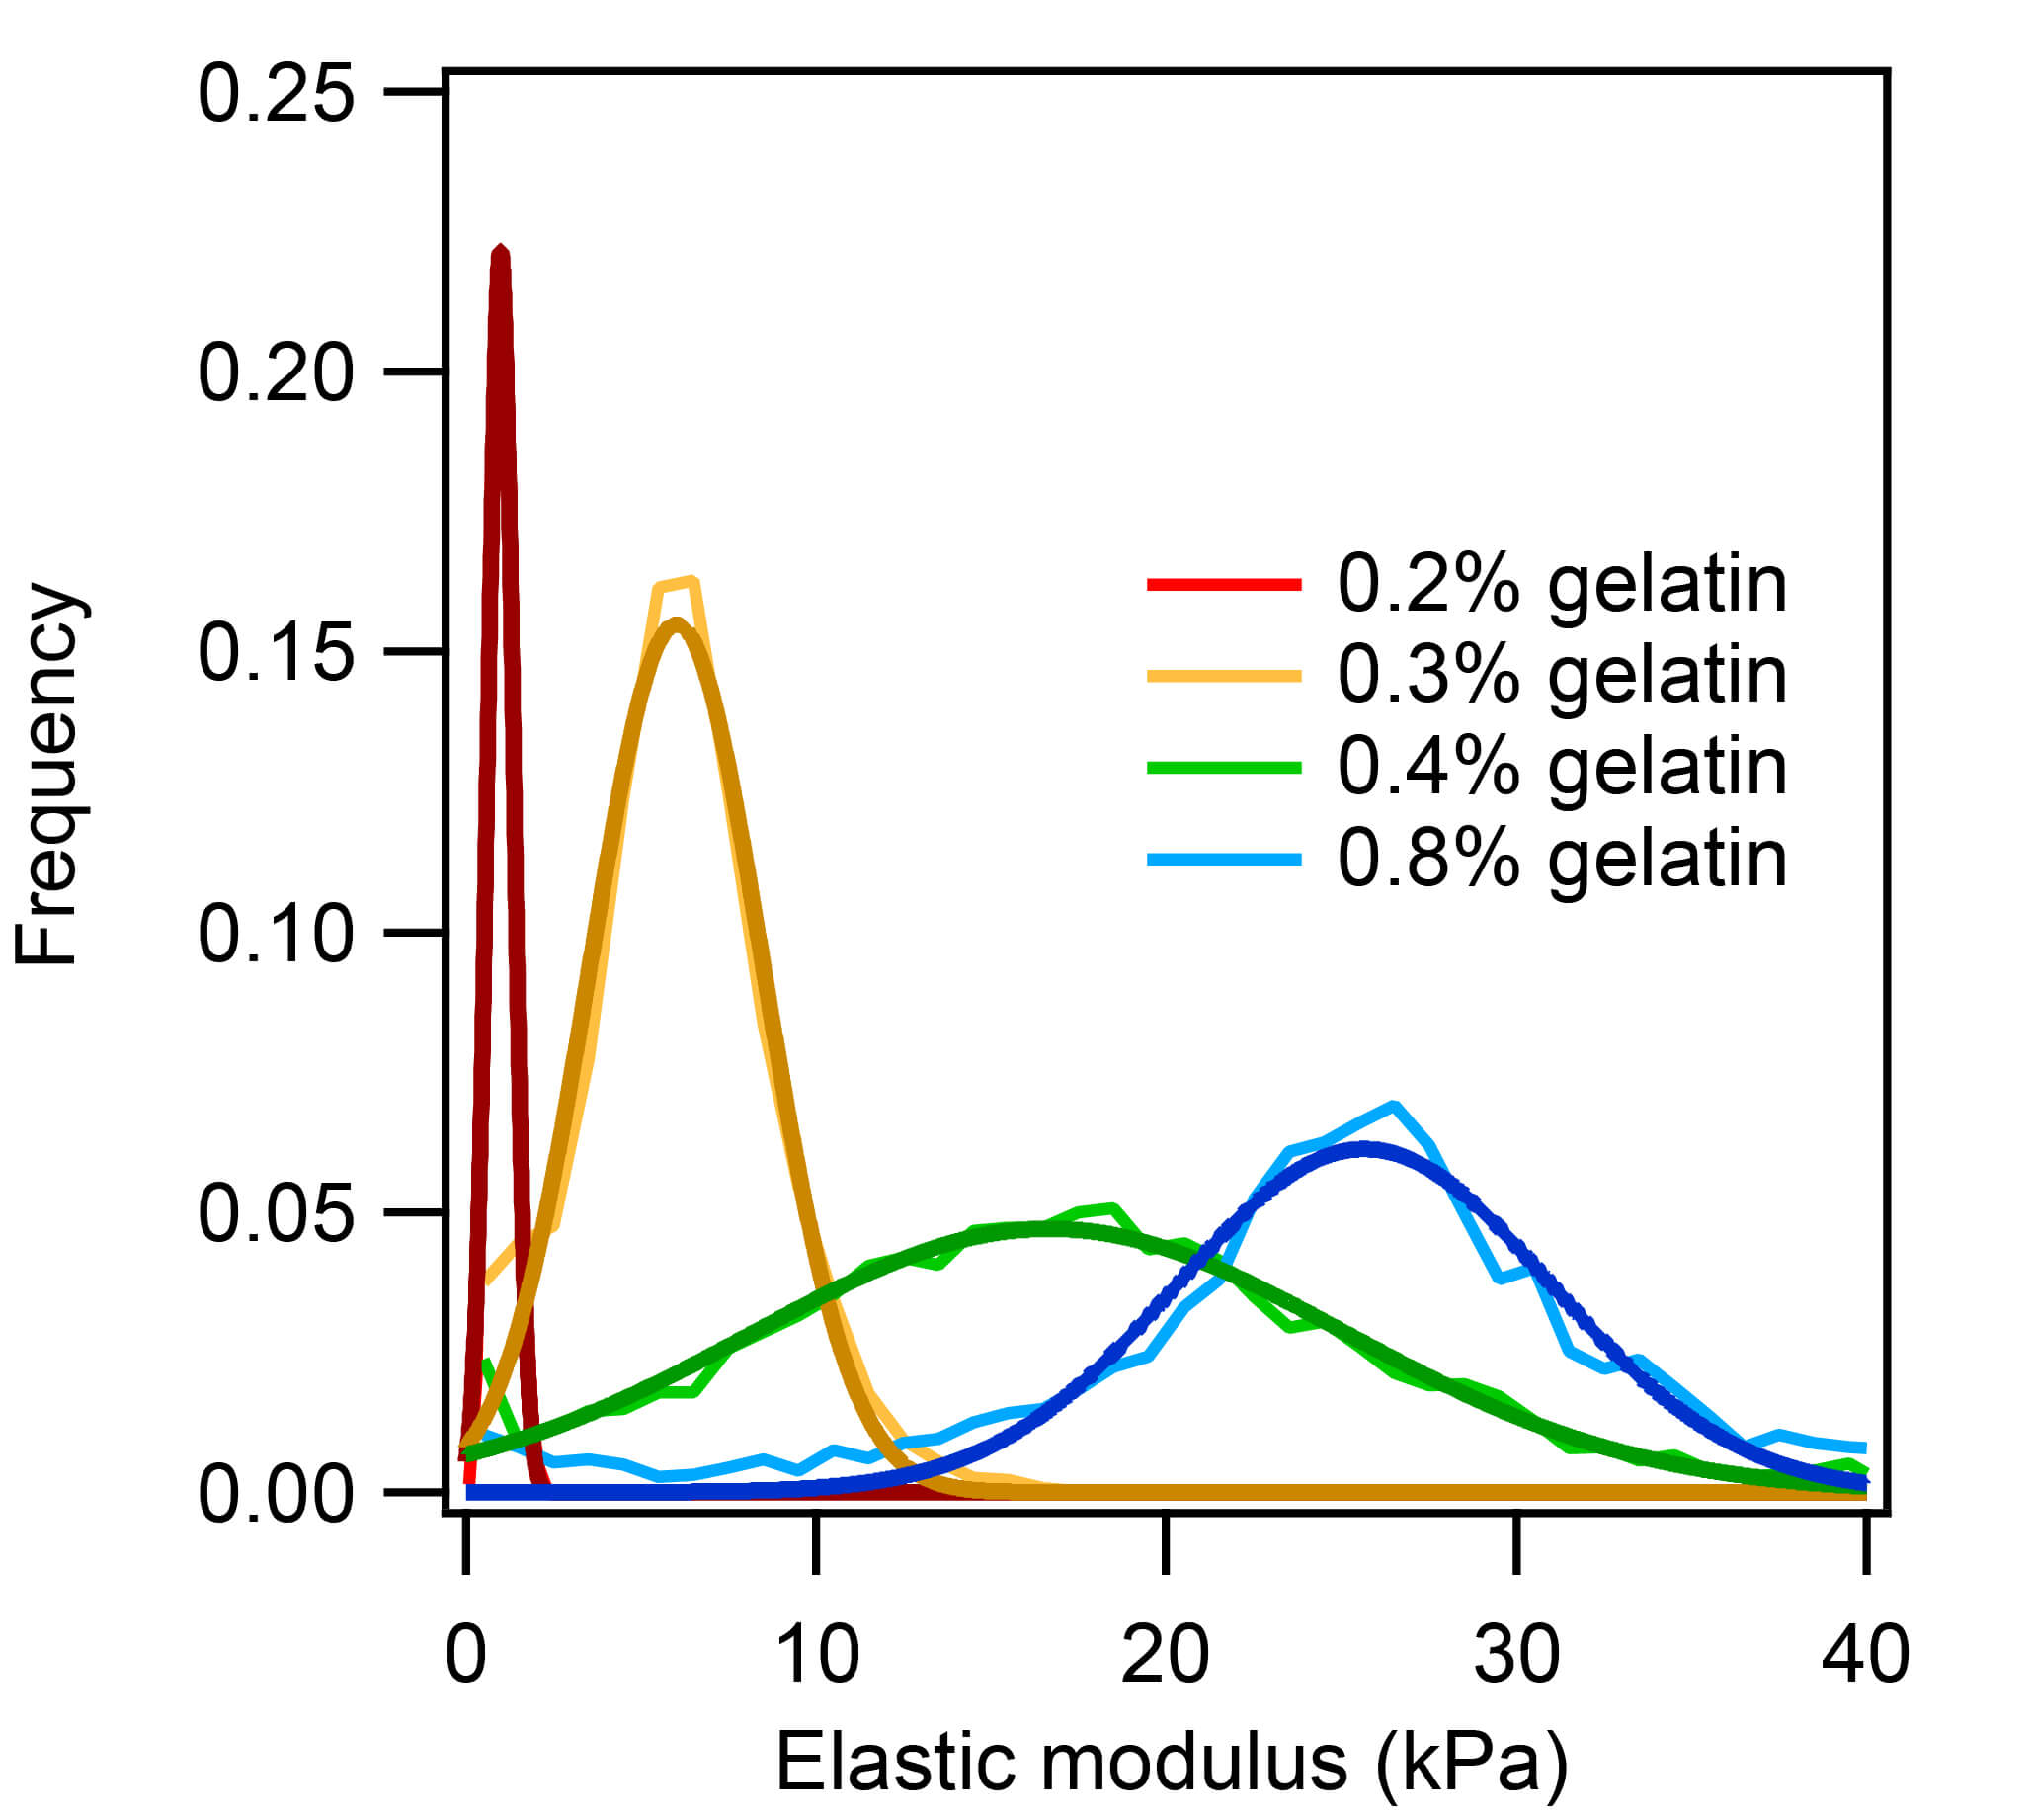
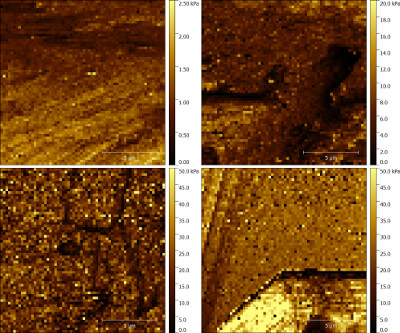
As expected, the analysis showed that the elastic modulus increases along with the gelatin concentration. Interestingly, the elastic modulus maps indicate that the gelatin surfaces are not homogeneous but show local variations with respect to the elastic modulus. Cells can sense the elastic modulus of their surrounding at the nanoscale. Therefore, the heterogeneity is as important for quality assessment as the bulk modulus itself.
View or download application note as PDF

Elastic modulus distributions obtained on hydrogels containing 02.%, 0.3%, 0.4% and 0.8% (w/v) of gelatin. As expected, the elastic modulus increases with the gelatin content of the gel. The gel with the lowest gelatin concentration showed an elastic modulus of <1 kPa.
Force curves were recorded on gelatin gels equillibrated and immersed in ddH2O. A soft Nanosensors qp-SCONT (knom=0.01 N/m) was used for all measurements. The elastic modulus was obtained from the force curves applying the Sneddon model. The histogram shows the pooled results of at least two different areas probed on each gel.

Elastic modulus maps for 0.2% (top left), 0.3% (top right), 0.4% (bottom left), and 0.8% (bottom right) gelatin hydrogels. The maps are not fully homogeneous within the probed area of 15 x 15 µm2, e.g. cracks in the 0.4% gel can be identified. The color scale bar corresponds to 2.5 kPa for 0.2%, 20 kPa for 0.3%, and 50 kPa for 0.4% and 0.8% gelatin, respectively.

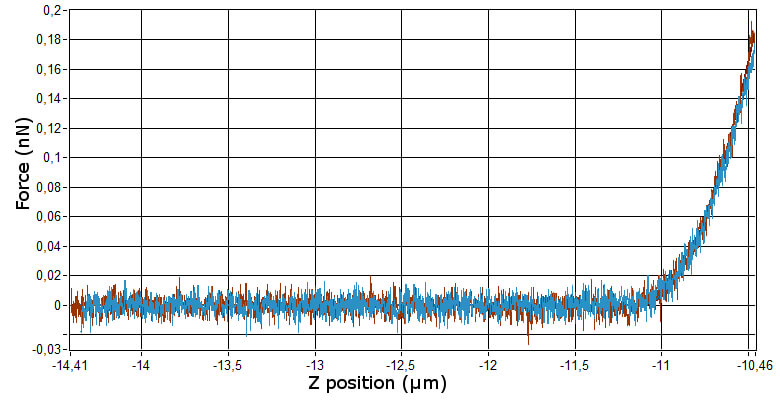
Typical force-distance curve (raw data) recorded on the 0.2% gelatin hydrogels. The force setpoint for the elasticity measurements was set to 200 pN.
The ANA software was partly developed within the framework of the OYSTER project, which has received funding from the European Union’s Horizon 2020 research and innovation program under grant agreement No 760827.

Nanosurf application note AN00856

