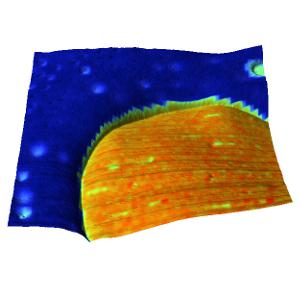
AFM-based force spectroscopy was used to characterize a polymer blend consisting of polystyrene (PS) and polybutadiene (PB). Data analysis or an array of force distance curves revealed differences in the material properties of the two components.

3D topography of the PS-PB blend overlaid with the stiffness map derived from the force-distance curves recorded on the same area. The DMT model was used to derive the sample stiffness from the force distance curves.
Data processing: SPIP and Gwyddion
Cantilever: PPP-NCSTR
Image size: 15 µm
Stiffness range: 4 GPa (log scale)

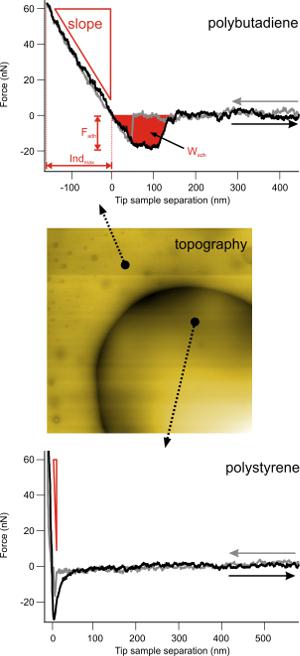
Example force-distance curves from different areas of the investigated PS-PB blend. The top and bottom panels show force-distance curves recorded on PB (top) and PS (bottom), respectively. The arrows in the topography image in the middle panel indicate the location where the force-distance curves were recorded. As indicated in the top panel, different information can be extracted from a force-distance curve: slope of the contact region, sample indentiation, max. adhesion force, and the work required for detachment. The slope itself a rough estimate of the sample stiffness, i.e. the PB is much softer than PS because the slope of the contact part is shallower (see red triangles). Analysis of the force distance curve using a contact mechanics model, such as the DMT model, reveals the actual stiffness of the sample.

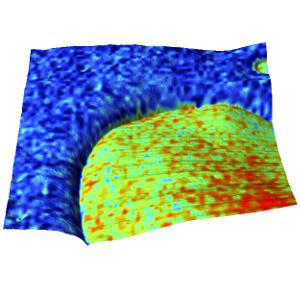
3D topography of the PS-PB blend overlaid with the adhesion map derived from the force-distance curves recorded on the same area.
Data processing: SPIP and Gwyddion
Cantilever: PPP-NCSTR
Image size: 15 µm
Max. adhesion force range: 20-40 nN
Related content:
- Single molecule force spectroscopy of bacteriorhodopsin
- Spring constant calibration by frequency sweep
Flex-ANA
- Spectroscopy (formerly Flex-ANA) measurement on gelatin hydrogels
- Spectroscopy (formerly Flex-ANA) measurement on medical tubings
- Force mapping of living cultured cells
Flex-FPM
View application note (PDF)
