Since the advent of biocompatible hydrogels in the early 1960s these materials have attracted a lot of interest from biomaterial researchers. Nowadays, various hydrogels are used in a wide range of biomedical applications including contact lenses, artificial wound dressings, thickening and stabilizing agents for release-controlled drug products as well as drug delivery of small molecules and proteins. Hydrogels are also more and more used for 2D and 3D cell culture systems as they allow mimicking the mechanical environment of life tissue.
Alginate gels in particular have been used for many of the before mentioned applications due to their high porosity, intrinsically low protein adsorption properties, chemically adaptability and lack of ligands binding to mammalian cell surface receptors. The gelation process that depends on multivalent ions allows straight-forward formation of flat gels but more interestingly also of spherical particles. Such particles can be used to incorporate and deliver drugs, proteins but also cells for biomedical applications. Depending on the application, porosity and mechanical properties of the alginate gels play important roles. Therefore, these parameters need to be characterized in detail to reveal e.g. not only the bulk elasticity but also the homogeneity of the elasticity of such a gel.
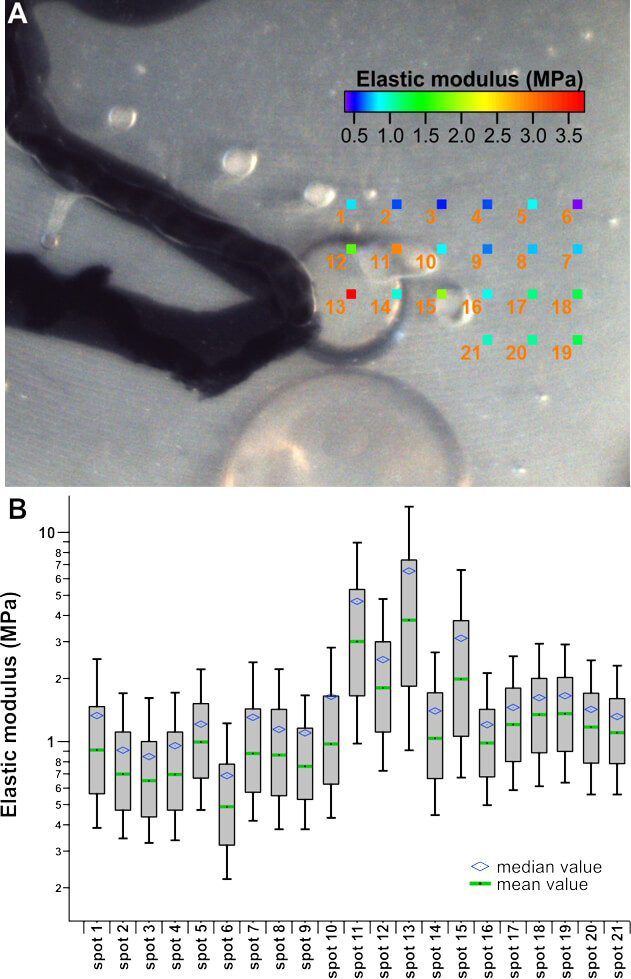
Here we used the Nanosurf Flex-ANA system to investigate the elasticity of flat alginate gels for cell culture. Analysis of different areas of the gel at different resolutions revealed a significant spatial heterogeneity of the gel at the macroscopic level as well as at the microscopic level. Additionally, the force curve-based elasticity measurements also reveal first information about the porosity of the sample.

(A) Optical image of the sample. The black lines indicate the boundaries of the glass-supported gel. The colored squares correspond to the median elastic modulus measured at 21 different spots (40 × 40 µm2 area) on the alginate gel. The median elastic modulus varies between ~500 kPa and ~4 MPa. Also within a single spot area, a considerable spread of the elastic moduli can be observed. The box-whisker plot (B) indicates the distribution of the elastic moduli within each measured spot. The boxes shown in B represent the 25 to 75 percentiles while the whiskers represent the 10 and 90 percentiles. The green bars in B indicate the median elastic modulus for each spot. The shift of the average elastic moduli (blue diamonds) to higher values compared to the mean values underlines the tailing of the elstic modulus distributions towards higher values. The numbers next to the squares in A correspond to the spot numbering in the box-whisker plot.

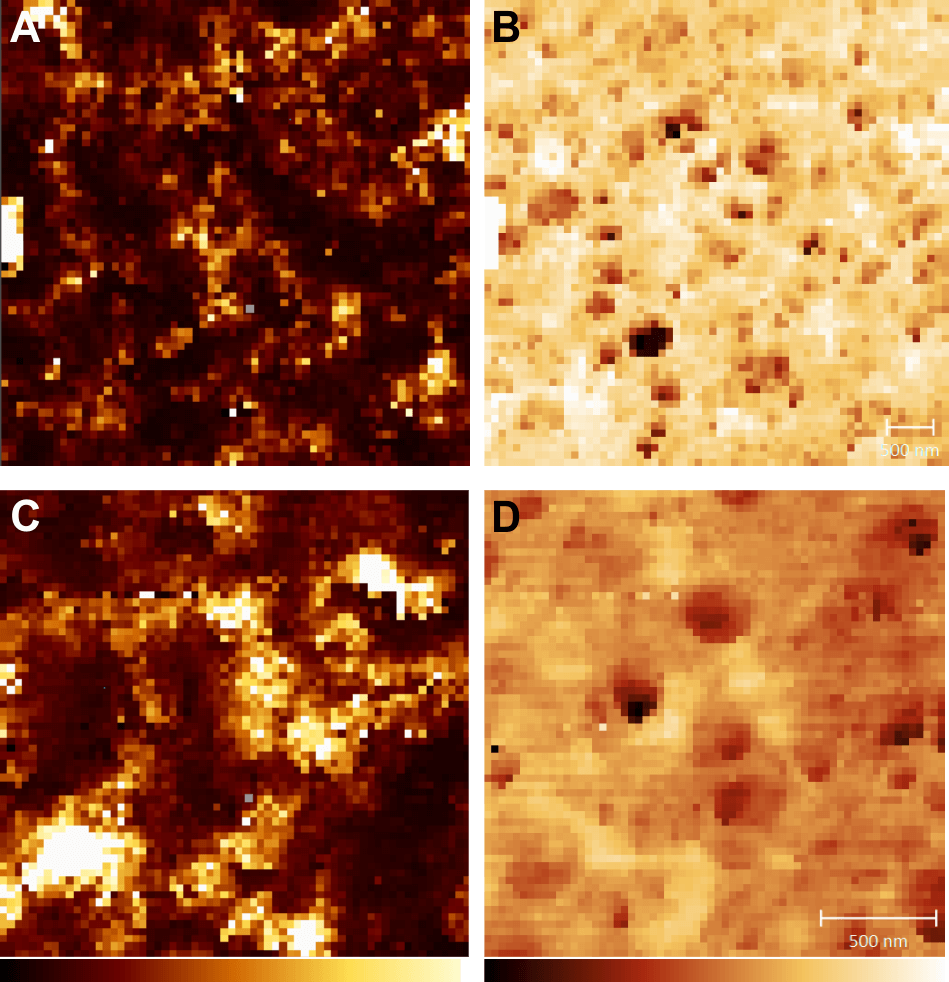
Force maps recorded on a 5 × 5 µm2 (A & B) and 2 × 2 µm2 area (C & D) show the local elastic modulus variations within each area (A & C) as well as the zero force height of the sample (B & D) that corresponds to the unperturbed sample topography. The elastic modulus maps show considerable local differences of the elastic modulus on the sub-micrometer scale. The height maps indicate a heterogeneous sample porosity. The elastic modulus contrast does not correlate with the sample topography.
All measurements were performed in aqueous solution with 300 mosmol CaCl2 using a Nanosensors qp-CONT cantilever with a nominal spring constant of 0.1 N/m. The Flex-ANA software package was used to acquire 2500 force-distance curves for each spot and to perform analysis using the Sneddon model.
Request more information on Flex-ANA
Nanosurf application note AN01030

