Polymer blends are frequently used for preparation of e.g. thin films instead of the individual homopolymers, as the blends exhibit more desireable characteristics. Unfortunately, the components of such films are often not compatible with each other and will demix during film production, thus determining the film morphology. This morphology may strongly influence the final properties of the film. To understand the effects of different preparation methods on the morphology of such polymer blend films, the distribution of the different blend components within the film needs to be visualized.
AFM phase imaging is a powerful tool to obtain contrast based on material properties along with topographic information. Here we used the CoreAFM to measure the SBS (poly(styrene-butadiene-styrene)) and PS (polystyrene) polymer blend sample from the phase imaging mode kit. For this application note, a spin-cast polymer blend film was prepared on mica.

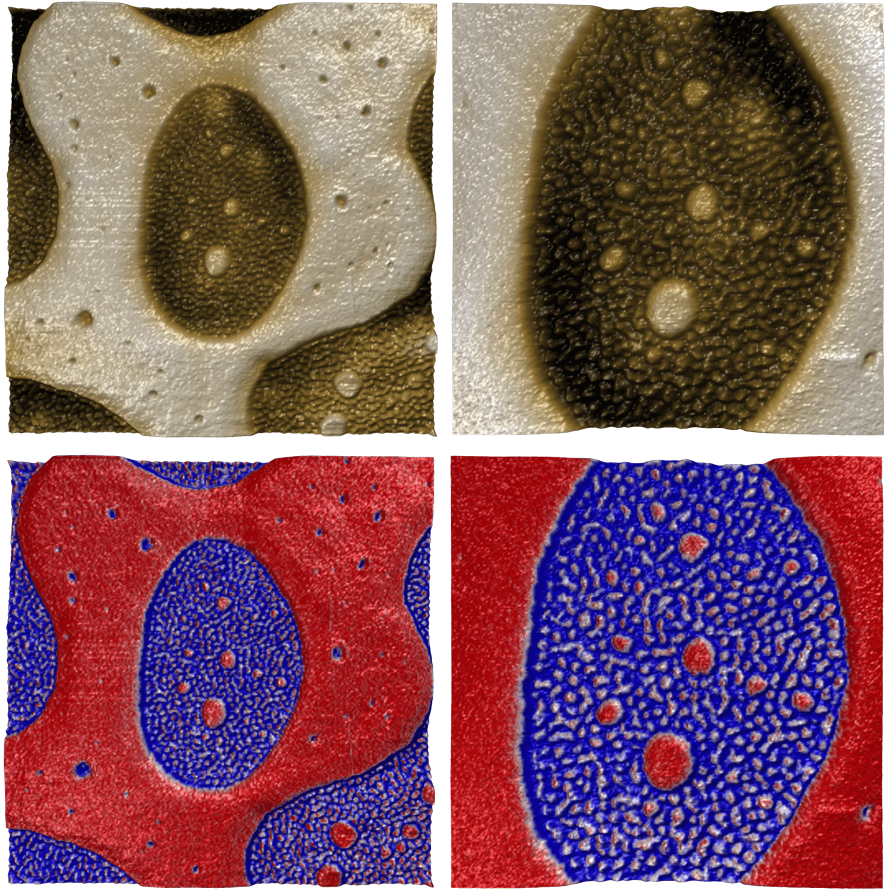
Topography (top row) and phase images (bottom row) at scan ranges of 2 µm (left column) and 1 µm (right column) of a spin-cast SBS-PS blend film on mica. The topography images clearly show two different height levels. The lower level phase exhibits a wrinkled topography that is more evident in the 1 µm-sized scan. The phase images show that the different height levels correspond to different material, i.e. polymers in this case.
The image recorded at 1 µm scan size shows the area in the center of the 2 µm scan size image. The height range of the images corresponds to 30 nm and the phase range to 20°.

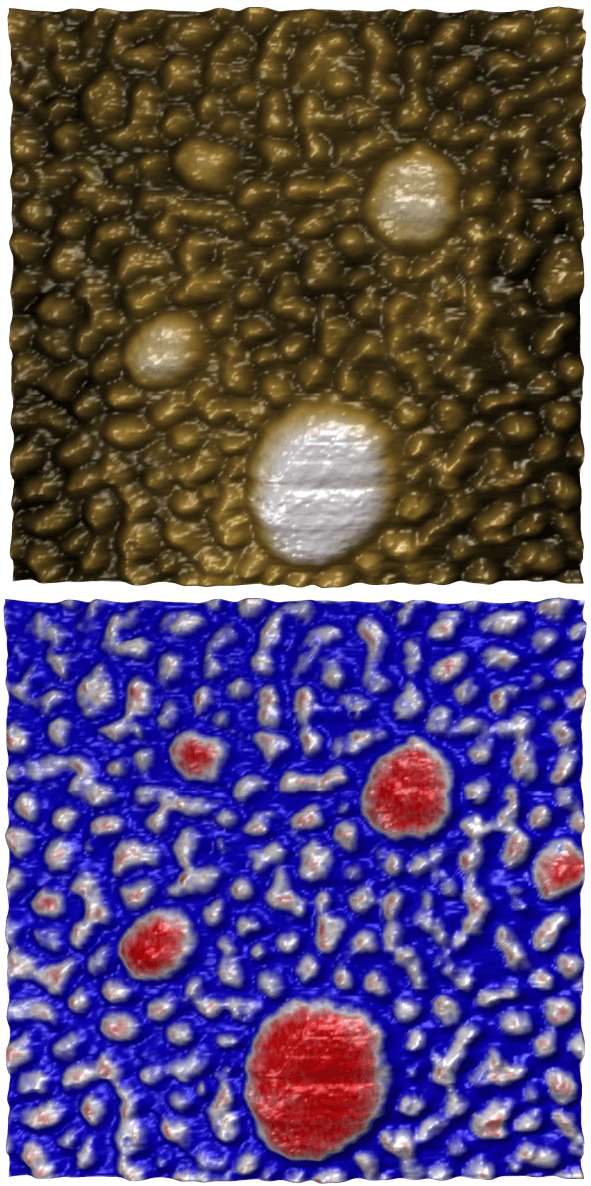
Topography (top) and phase (bottom) images show a an area of the previously shown images at higher resolution. The topograpyh image clearly shows small islands of the second polymer within the surroundig wrinkled matrix. The phase image clearly identifies the islands as a different material. The wrinkles also show a different phase signal compared to their surrouding, indicating that they are most probably composed of the same material as the islands. The diameter of the wrinkles ranges from ~10 to ~30 nm.
All measurements were performed using a Nanosurf CoreAFM equipped with BudgetSensors Tap190 cantilevers. Images were processed using MountainsMap SPM Software.
Related content:
Nanosurf application note AN01071

